

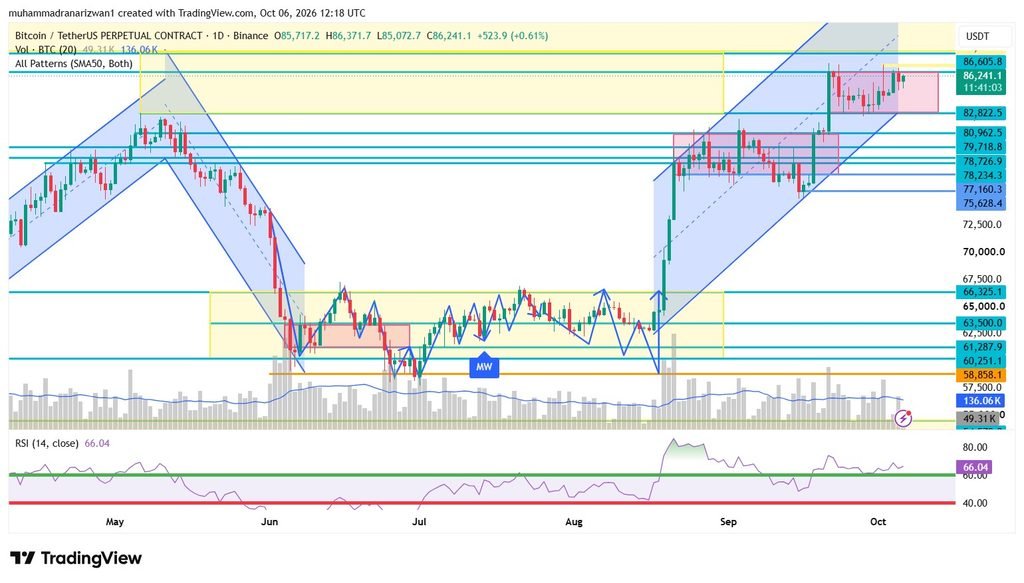
Bitcoin is approaching an important resistance area after a strong recovery. At the time of the chart snapshot, BTC was trading around $86,241, with buyers testing the upper boundary of a recent consolidation.
The immediate question is whether Bitcoin can establish support above $86,606 and extend through $87,200, or whether another rejection will trigger a pullback toward lower liquidity levels.
The outlook remains constructive within the illustrated rising channel, but a breakout still requires confirmation.
What the Daily Chart Shows?
Bitcoin has recovered significantly from its August lows and is trading within an upward-sloping channel. Its recent consolidation sits between approximately $82,823 and $86,606.
This places price near the top of its current range, where entering without confirmation can expose traders to a failed breakout.
The daily Relative Strength Index, or RSI, was approximately 66.04 at the snapshot. This supports positive momentum but does not guarantee further gains. An elevated RSI can persist during an uptrend, while a loss of momentum near resistance can still produce a correction.
The daily candle was unfinished when the chart was captured. Its closing price and final volume therefore remained unconfirmed.
Key Price Levels to Watch
| Price level | Significance |
|---|---|
| $86,606 | Immediate resistance on the daily chart |
| $86,917–$87,170 | Potential overhead liquidity area from the accompanying market dashboard |
| $85,245 | First downside liquidity reference |
| $84,303 | Secondary downside liquidity reference |
| $82,823 | Lower boundary of the recent consolidation |
| $80,963–$79,719 | Deeper support zone if the consolidation breaks down |
The liquidity references are estimates recorded in the Daily Watching dashboard for October 6. They can change as positions open and close and should not be treated as guaranteed price targets.
Bullish Scenario: Breakout Followed by Support
The continuation case strengthens if Bitcoin breaks through the overhead resistance area and holds it during a retest.
A conditional long setup would require a completed one-hour candle above $87,200, followed by evidence that the $87,000–$87,200 area is acting as support.
- Potential entry zone: $87,000–$87,200 after confirmation.
- Stop-loss reference: $86,450.
- First target: $88,300.
- Second target: $89,500.
- Extended target: $90,400.
The extended target is an approximate measured-move projection based on the height of the current consolidation. It is not a confirmed historical resistance level, and reaching it may require more than one trading session.
A move back below the breakout area would weaken this setup. If price rallies without providing the planned retest, chasing the move changes the trade’s risk profile.
Bearish Scenario: Rejection and Failed Retest
A short-term bearish setup becomes relevant if Bitcoin tests $86,917–$87,170, rejects that area, and closes below $86,600 on the one-hour timeframe.
The next requirement would be a failed attempt to reclaim $86,600 from below.
- Potential entry zone: $86,550–$86,650 after confirmation.
- Stop-loss reference: $87,350.
- First target: $85,245.
- Second target: $84,303.
- Extended target: $82,823.
This would be a countertrend trade within the broader recovery shown on the chart. Sustained acceptance above $87,200 would undermine the rejection thesis.
A pullback toward $85,245 would not, by itself, confirm a major trend reversal. A more significant deterioration would involve losing $82,823 and failing to reclaim it.
Trade Execution and Risk
These are conditional scenarios rather than immediate buy or sell instructions. The daily chart establishes the broader context, while the one-hour triggers require separate confirmation.
Position size should reflect the distance between entry and stop-loss. Fees, funding costs and slippage affect the final outcome, and stop orders may execute beyond their specified price during fast moves.
If neither scenario develops, waiting remains a valid decision. These levels should be reassessed if market conditions change or the targets are reached before an entry occurs.
For this snapshot, the main decision area is $86,606–$87,200. Establishing support above it would favour continuation; rejection would put the lower liquidity references back in focus.
Want to understand how to identify market structure, plan conditional entries and manage risk? Explore one-to-one trading mentorship with AD Investment Solutions.
Sources: Author’s Binance BTC/USDT perpetual daily chart on TradingView, captured October 6, 2026, at 12:18 UTC; accompanying Daily Watching market dashboard.
Disclaimer: This dated analysis is for educational purposes and is not personalised investment advice. Cryptocurrency and leveraged trading involve substantial risk. The scenarios are not live signals, and no outcome is guaranteed.